Problem and Background
Youth, high-school, and amateur sporting events take place in many locations. Friends and family members of athletes will often travel to towns and cities they are not familiar with to watch and support the athletes. For example, a typical high school basketball team will play roughly half its games “on the road”, that is away from the “home” location, gymnasium, field, etc. These trips are rarely longer than a single day, and in many cases last only a few hours. Everyone is busy - parents, kids, siblings, friends, athletes, and the coaches - and with such short trip durations, extensive planning is frequently not worth the effort.
Organizations like prep schools, will draw families and students from a wide geographic area. Amateur endurance athletes competing in sports like marathons and triathlons will often use online coaching. In both cases, the crux is that “local knowledge” about these “away” locations may be unavailable to the coaches, athletes, and their families; leaving recommendations for simple things like “where to eat” hard to find.
Coaches would like friends and families to have enjoyable experiences when they travel to support athletes. The coach is frequently the center point of all the communication to athletes and athlete’s families, and as a result may get frequent questions similar to “Where’s a good place to eat after the game ?”. The problem is that coaches don’t have a simple way to provide a “local guide” for each location on the schedule, and usually don’t have the staff or time available to do this manually.
The core questions from a coach’s perspective:
(1) Which locations on the schedule have the most options and least options for friends and families ? Specifically for food, coffee, snacks, etc; that is which locations have services that would be useful for friends and families either before or after a sporting event.
(2) Can each location be labeled in a way to indicate if additional planning is prudent or pragmatic? These labels would convey total options available at given location to help friends and families in their travel planning. If there are many options, little additional planning needs to be done; If there are few options, significant additional planning might be needed.
(3) Provide a selection of a few the most popular or highly recommended venues in each location.
Answering these questions enables a coach to provide information to support travel planning for upcoming sporting event to athletes, their friends and families, as well as other supporters in the community.
Deriving the Answer
A description of the data and how it will be used to solve the problem.
Analytic Approach
The analysis will be focused on descriptive models and patterns, as the gist of the problem is creating a summarized view of each location on the schedule. Questions around rankings will be analyzed with basic statistical counts and averages. Location classification and labeling will be analyzed with classification algorithms (decision tree) as well as clustering algorithms to see which model best fit the desired outcome.
Data Collection & Requirements
This analysis will be limited to sporting events held in the USA.
The core data elements and potential source of data is as follows:
- Location Information of each event.
- Data type is a text, in the form of City & State; e.g. Lawrence Academy, Groton, MA, or Skeetwater Triathlon, Lithia Springs, GA, or Boston Marathon, Boston, MA
- Source of location data will be from a coach, or from scraping the online schedules where available.
- Latitude & Longitude for each event location.
- Data type is a pair of decimal numbers, as in (42.604433, -71.5628436838169), which are the coordinates for Lawrence Academy.
- Source of coordinates will be Open Street Maps Nominatim geocoding service.
- Venue Information for each location.
- Data type for venue information will be JSON Object containing many attributes. Specific data fields can be explored in the Foursquare Documentation
- Source Venue information is Foursquare API
Data Understanding & Preparation
The key activity here will be to validate the data set can be constructed and that the data is accurate and complete. This work includes capturing the data, dealing with missing values, and transforming the data into a format that is easy to analyze.
This is also the beginning stages of model development, as constructing the models is the confirmation that the data collected is actually ‘fit-for-purpose.’ If the models produce strange or unexpected results, the data completeness and quality will be revisited.
Data visualizations and numerical summaries (sums, counts, averages, etc) will be the initial tools of analysis. After the initial analysis is completed, model construction and evaluation for clustering or classification models will be done.
The models should generate:
- A Location Score that can be used to rank each location.
- A Location Label that can be used to inform the amount additional planned recommended for this location
Capstone Presentation
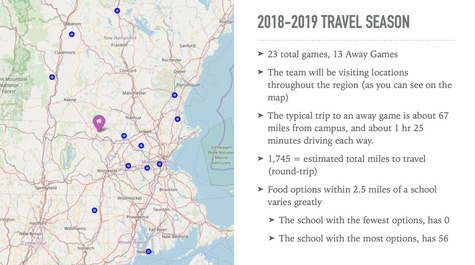
The data analysis was used to create a presentation which a coach could share with athlete’s, friends and families, as well as anyone else who might be traveling to support the team at an away game.
Capstone Report
The full capstone report contains more details on the data processing, methodology, and analysis work. If you are interested in this detail, the full capstone report is here.
About the Course
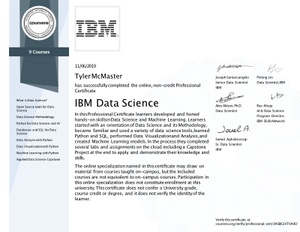
IBM’s Professional Certificate Program program consists of 9 courses covering a wide array of data science topics including: open source tools and libraries, methodologies, Python, databases, SQL, data visualization, data analysis, and machine learning. More details are on the Coursera Course Page.
The Course List:
- What is Data Science
- Open Source tools for Data Science
- Data Science Methodology
- Python for Data Science and AI
- Databases and SQL for Data Science
- Data Analysis with Python
- Data Visualization with Python
- Machine Learning with Python
- Applied Data Science Capstone Project
My Certification:
Get in Touch
Have a similar project ? Feel free to reach-out to me if you’d like additional information, about the tools, my workflow, or anything else.

